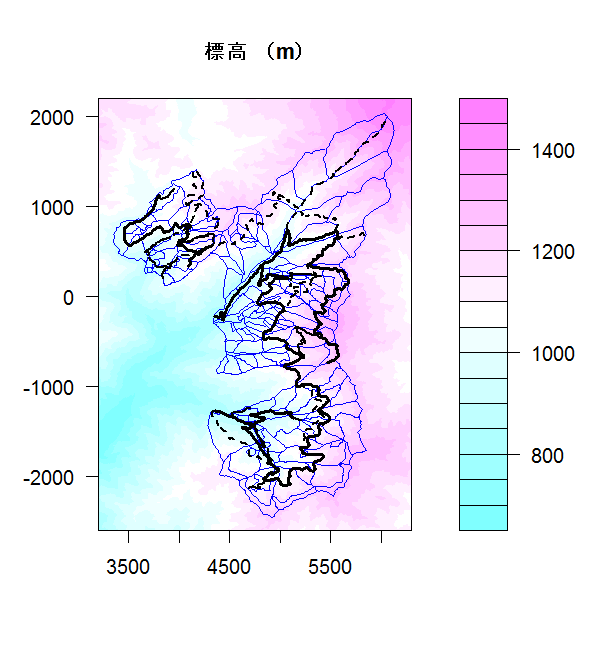
##### 標高

windows(6.5,7)                               ###キャンバス

load("x-y-dem.dat")                          ###データの読み込み

                                             ###作図

filled.contour(x,y,dem,

  plot.axes={axis(1);axis(2);map()},main="標高 (m)")